Step 6. Collect Information About the Current R Session.
Contact Us
The Centre for Artificial Intelligence Driven Drug Discovery (AIDD) at Macao Polytechnic University
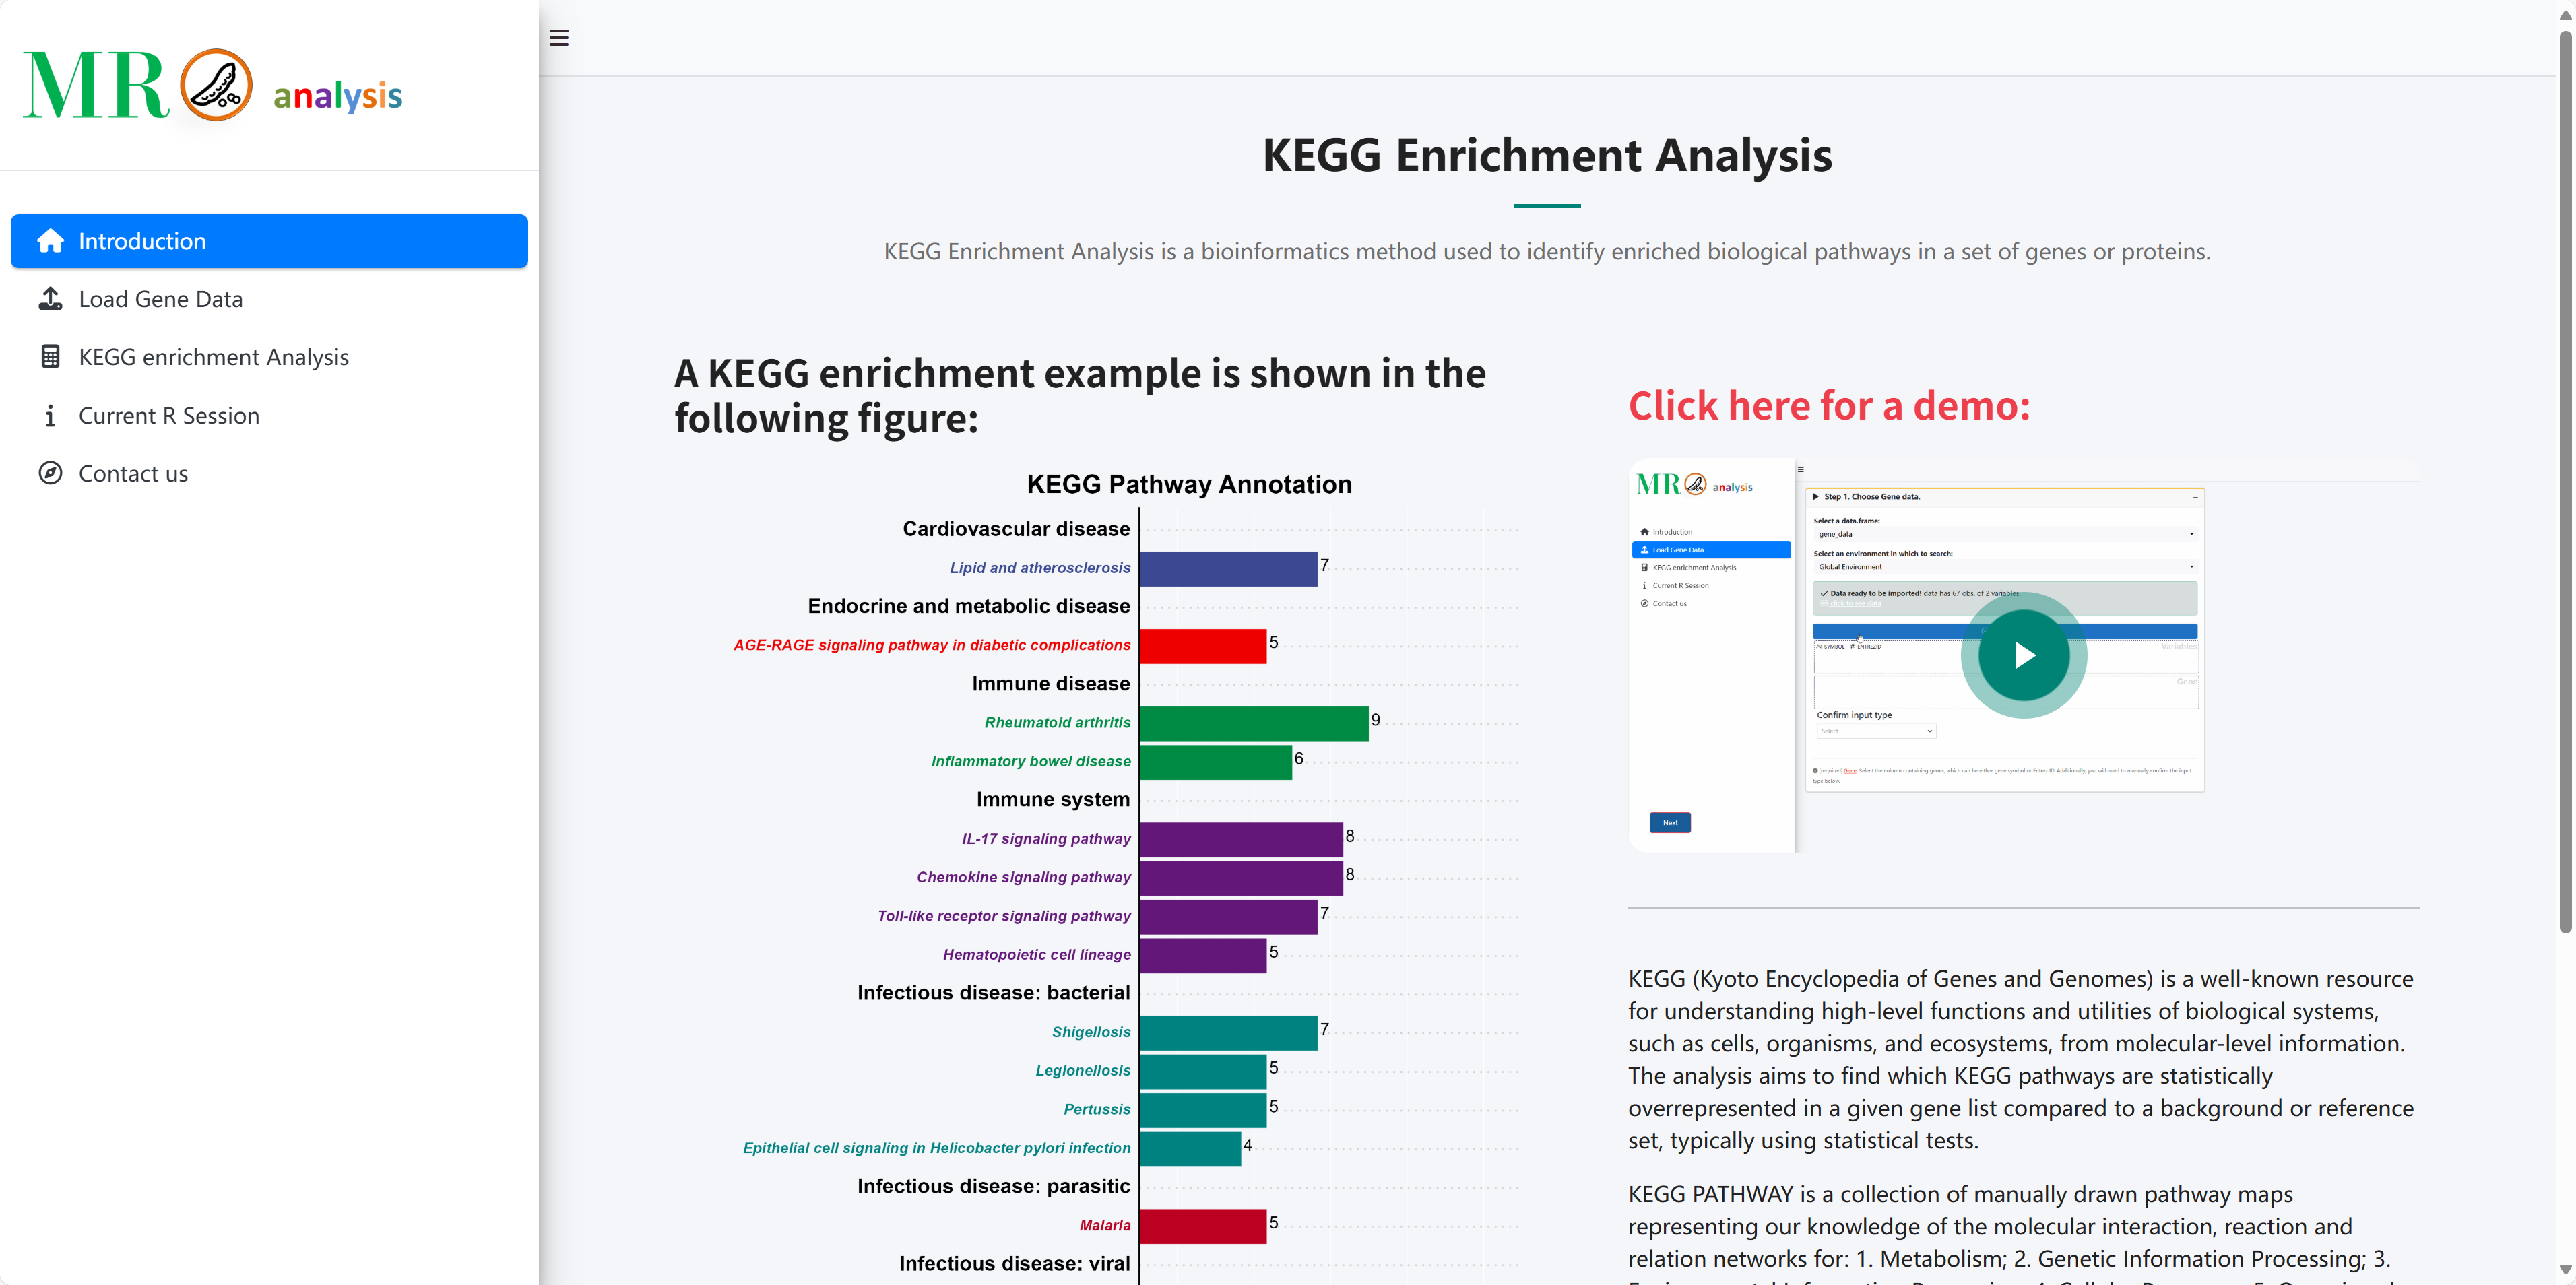
KEGG Enrichment Analysis
KEGG Enrichment Analysis is a bioinformatics method used to identify enriched biological pathways in a set of genes or proteins.
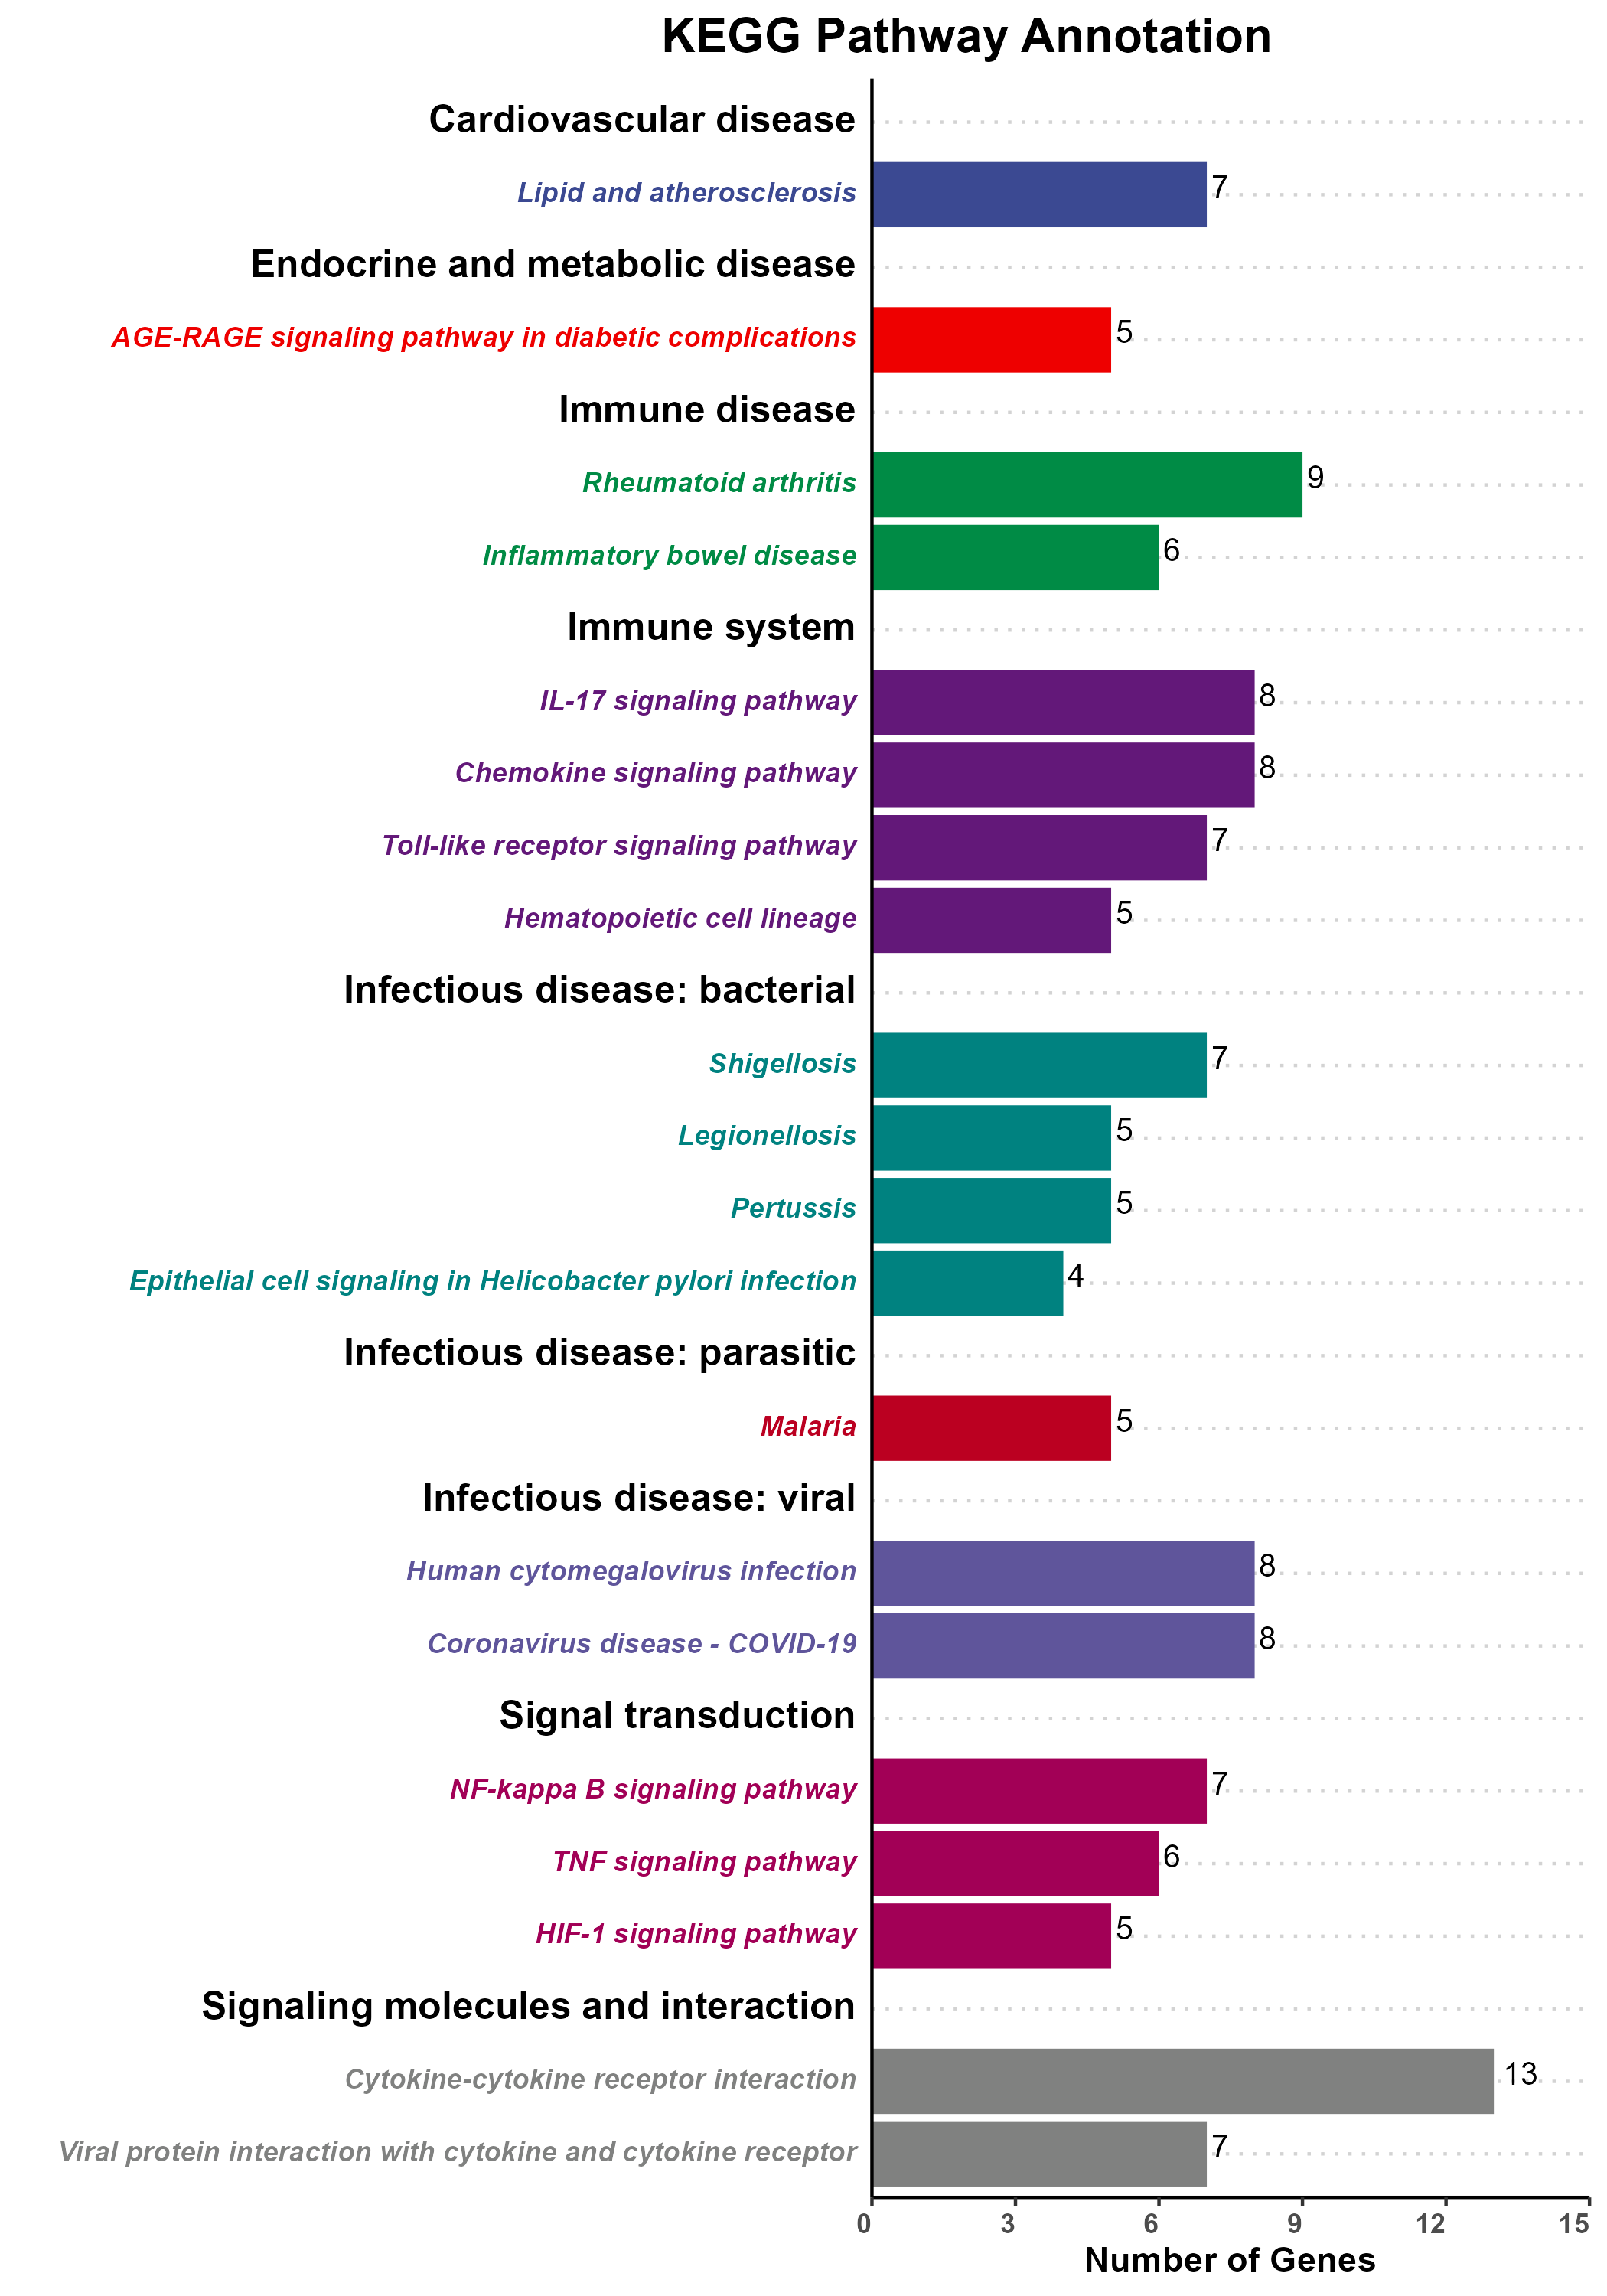
A KEGG enrichment example is shown in the following figure:
Click here for a demo:
KEGG (Kyoto Encyclopedia of Genes and Genomes) is a well-known resource for understanding high-level functions and utilities of biological systems, such as cells, organisms, and ecosystems, from molecular-level information. The analysis aims to find which KEGG pathways are statistically overrepresented in a given gene list compared to a background or reference set, typically using statistical tests.
KEGG PATHWAY is a collection of manually drawn pathway maps representing our knowledge of the molecular interaction, reaction and relation networks for: 1. Metabolism; 2. Genetic Information Processing; 3. Environmental Information Processing; 4. Cellular Processes; 5. Organismal Systems; 6. Human Diseases; 7. Drug Development.
This application is conducted using clusterProfiler[1] (v4.6.2) in R.
[1] Xu, S., Hu, E., Cai, Y. et al. Using clusterProfiler to characterize multiomics data. Nat Protoc (2024). https://doi.org/10.1038/s41596-024-01020-z
Step 1. Choose Gene data.
[required] Gene. Select the column containing genes, which can be either gene symbol or Entrez ID. Additionally, you will need to manually confirm the input type below.